This section will give a brief overview of the different parts of the Hydrograph UI. For more detailed information on specific parts of the UI, please see the User Guides section of the documentation.
1. Menu Bar & Tool Bar
2. Component Palette
3. Project Explorer
4. Job Canvas
5. Job Console
6. Run Configuration
7. Parameter Grid
In Hydrograph the Menu Bar contains drop down menus with options to create/open files, display help content, import/export projects, set run-related configurations, show/hide elements on the canvas, and open/close specific windows.
The Hydrograph Tool Bar provides easy access to commonly used operations such as: creating a new job, opening a file, cut, copy, paste, delete, undo, and redo. Along with these operations, the tool bar also includes buttons for setting the Run Configuration, opening the Parameter Grid, starting a job, and killing a running job.

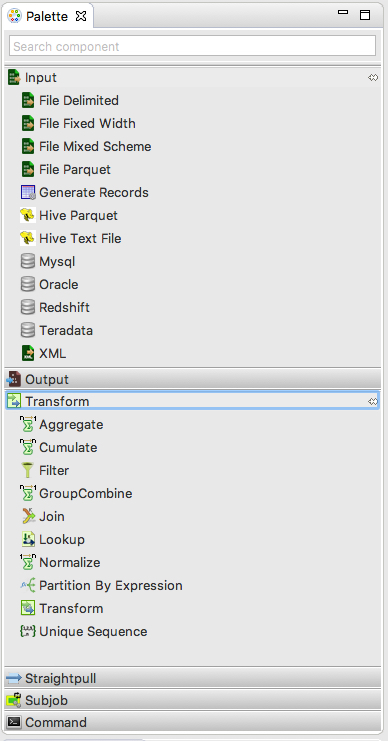
The Component Palette contains a list of all components that can be placed on the canvas. Users can place components on the canvas by dragging the component into the canvas or by double clicking on the component.
Components are grouped into different categories based on their functionality. Currently components are grouped into the following categories - Input, Output, Transform, Straightpull, Subjob, and Command. In addition to this category-specific grouping, each component can be visually identified by an icon that summarizes component functionality.
To quickly find a component in the palette users can leverage the search bar at the top of the palette.
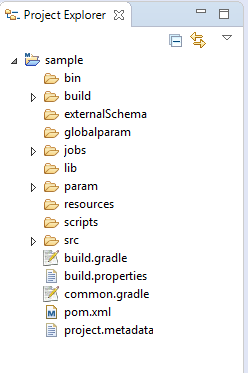
The Project Explorer displays a defined folder structure that manages the addition and deletion of new ELT jobs, Java classes, parameter files, XML files, build files, scripts, and the Hydrograph JAR file.
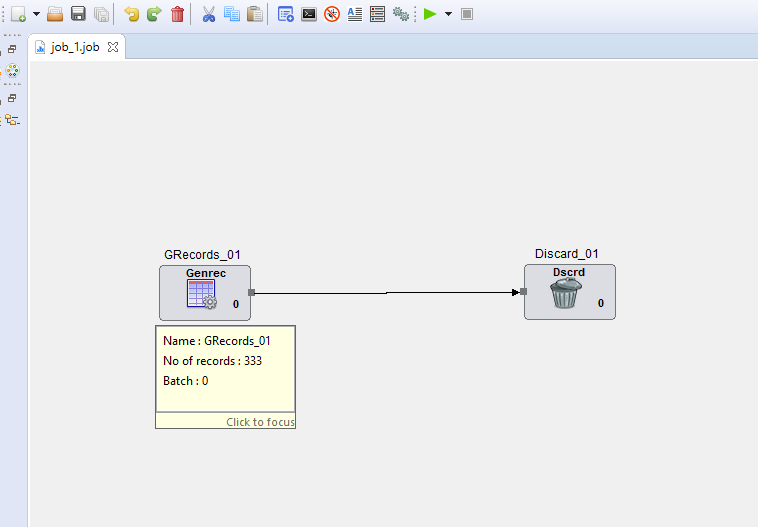
The Job Canvas is the central area of the UI where users can select components from the palette to construct an ETL job.
Components can be connected by links drawn from their respective ports. Component ports are visible as small rectangles on the edges of the components. Components may have IN, OUT, and UNUSED ports depending on the category of the component.
On mouse-hover a tool tip is displayed for the selected component. The tool tip displays the properties of the component along with any associated errors.
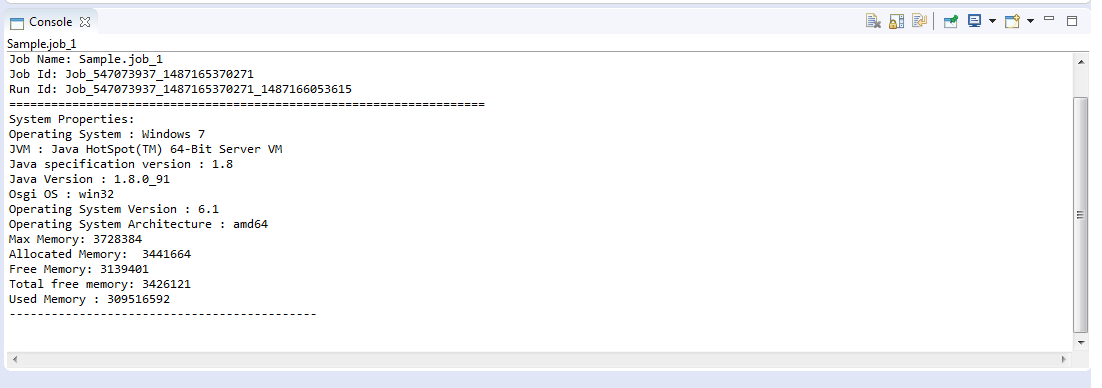
The Job Console displays step-by-step execution logs for the job that is currently running. The information displayed in the console log includes the timestamp and system details for each job execution step.
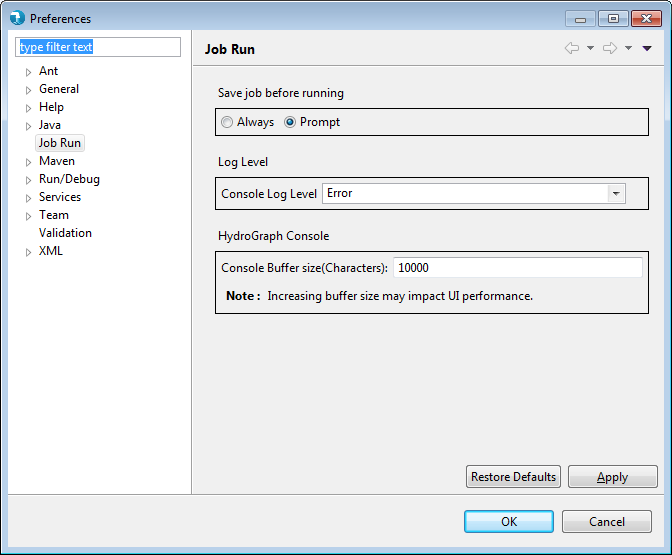
Hydrograph allows users to limit the number of characters included in the console by specifying the maximum buffer size. Once console output exceeds the specified maximum size output is truncated from the beginning of the buffer.
The default value for Hydrograph console output is 10000 characters. The max value for Hydrograph’s console log is 40000. If console output for a particular job execution exceeds the specified maximum users can retrieve the entire log file from the ‘job_logs’ directory at the Hydrograph installation directory.
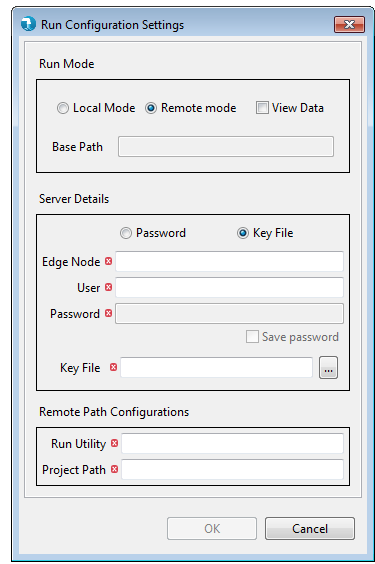
The Run Configuration window provides a user with the option to run a job in local or remote mode.
When executing a job in the local mode the user won’t need to provide any additional configuration details, and the job will be executed on the user’s local machine.
When selecting remote mode, the user will need to provide the edge node of a cluster where the job will be executed, along with a username and password or key file for accessing this node. Additionally, the user will have to specify the location of the run utility that will launch a job on the cluster. For more information about installing the Hydrograph run utility on a cluster please see the Remote Installation Instructions.

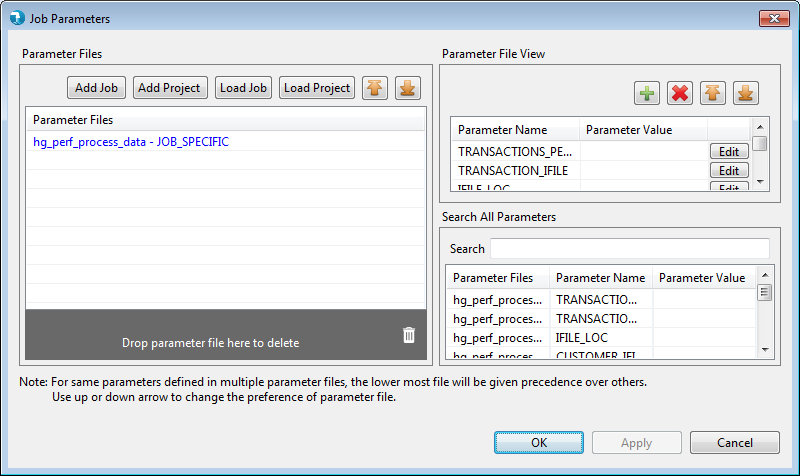
The Parameter Grid provides a user with the option to edit/add parameters for a job. The Parameter Grid window will be displayed when the user launches a job using the run button. Alternatively, the Parameter Grid window can be opened directly from the Tool Bar.
All component level parameters that have been created or used in the job get displayed in the parameter grid. Parameter names present in the job aren’t able to be deleted, but the user has the option to add additional parameters using the add (+) button. Users may also import a parameter file from the file system.
When a job is saved, the parameters are saved in a properties file under the ‘param’ directory. If the same parameter is defined in multiple files, the file that is lowest in the list will receive precedence. The up/down arrows allow you change the precedence of parameter files.